Research article 
 Creative Commons, CC-BY
Longitudinal Observation of Humoral Immune Response Along with Coagulation and Inflammation-Specific Clinical Biomarkers in A COVID-19 Convalescent Donor Cohort
*Corresponding author: Uwe Kalina, Research & Development, CSL Behring Innovation GmbH, Germany.
Received: July 04, 2022; Published: July 22, 2022
DOI: 10.34297/AJBSR.2022.16.002279
Abstract
In this longitudinal study on convalescent COVID-19 donors, we assessed the humoral response to SARS-CoV-2 and biomarkers of coagulation, fibrinolysis, inflammation, and endothelial function associated with disease severity and prognosis. Plasma donations and donor characteristics were collated for 26 adult convalescent donors over 168 days after initial molecular diagnosis of the infection. Parallel monitoring of live virus neutralization test, surrogate VNT, SARS-CoV-2 specific serology markers, and further biomarkers were evaluated. Neutralizing antibodies were found in all donors with an initial median titre of 510.5 International Unit/milliliter (WHO unit) and decreasing titer (2.7-fold) over the study period. Strong positive correlation was revealed between cellular VNT and sVNT as well as high-throughput anti-S1-RBD-SARS-CoV-2 antibody immunoassays. NAb, anti-spike S1, and anti-S1-RBD antibody levels significantly correlated with disease severity. Prolonged, markedly elevated D-dimer and prothrombin fragment 1+2 levels were assessed in 26.9% of the convalescent donors. Although acute-phase biomarkers and reactants of the complement system and endothelial function were in the normal range in most convalescents, we identified C-reactive protein, C3, and C4 being associated with severity. We observed robust but decreasing NAb progression and anti-S1/S1-RBD antibody levels correlated to disease severity. Donors with long-term symptoms had significant lower anti-S1, anti-S1-RBD, and anti-NC antibody, D-dimer, and Fibrinogen levels and higher SAA levels, compared to donors that fully recovered. While inflammatory biomarkers returned to normal in most convalescents, the persistence of abnormal D-dimer and F1+2 levels need further investigation to probe connection with pathogenesis.
Keywords: SARS-CoV-2, Convalescent, Longitudinal, Serology, Coagulation, Biomarkers, D-dimer
Introduction
The novel SARS-CoV-2 virus, causative agent of COVID-19, emerged in Wuhan, China at the end of 2019 and has since resulted in a global pandemic [1]. SARS-CoV-2 infection occurs via binding of the viral surface spike protein (S) to the cell-surface protein angiotensin-converting enzyme (ACE) 2 and is associated with a wide range of clinical symptoms, ranging from asymptomatic or mild illness to life-threatening conditions [2,3]. The mild cases are characterized by coryzal symptoms with fever whereas the life-threatening conditions are associated with dysregulation of the immune response, hypercoagulation, and pneumonia-induced acute respiratory distress syndrome (ARDS), reflecting a systemic endotheliitis [4,5]. SARS-CoV-2 infection generates Neutralising antibodies (NAb) of Immunoglobulin (Ig) M, IgG, and IgA classes targeting primarily the Spike (S) protein and the nucleocapsid (NC) protein of the virus that clear the viral particles and offers protection in most cases [6,7]. However, there is still lack of knowledge about a correlate of protection and antibody memory that are critical factors for treatment and vaccination strategies for COVID-19 [8]. Therefore, it is necessary to study the persistence and robustness of the NAb response against SARS-CoV-2 longitudinally. We analysed four high-throughput commercial assays for SARS-CoV-2 antibody response, together with one automated in-house surrogate Virus Neutralization Test (sVNT) and their correlation to neutralization titres..
While COVID-19 is recognized as a multi-organ disease, a major concern of COVID-19 is represented by a concomitant prothrombotic state [9,10]. Contrasting data are available about the prevalence of thrombotic complications, like venous thromboembolism (VTE), or arterial thromboembolism (ATE) [11]. Changes in coagulation and inflammation biomarkers are common in acute severe COVID-19 [12]. Elevated plasma levels of D-dimer, a fibrin degradation product (FDP), have been shown to be a biomarker for severity and poor prognosis with association to thrombotic events, while D-dimer staging at peak was also a predictor of critical lung injuries [13-15]. A recent study revealed, that elevated F1+2 levels were significantly associated with VTE and any thrombotic manifestation in hospitalized COVID-19 patients [16]. The physiological mechanism and persistence of elevated FDP, like D-dimers and biomarker of coagulation activation, including F1+2 in plasma, remain poorly understood in COVID-19 convalescence.
There are increasing reports of persistent and prolonged effects after acute COVID-19 [17,18]. To elucidate the role of coagulation activation, fibrinolysis, and microvascular thrombosis in COVID-19 pathogenesis, we did a longitudinal observation of F1+2, D-dimer together with other reactants of the fibrinolytic system and the acute response that includes plasminogen, α-2 antiplasmin, C reactive protein (CRP), serum amyloid A (SAA), and Fibrinogen. Von Willebrand factor and complement factors C3 and C4 were assessed as endothelial and complement activation markers.
Methods
Donor Cohort, Plasma Sampling, and Analysis
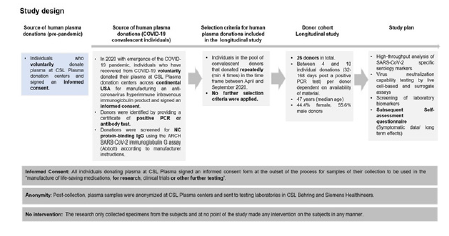
Source of Human Plasma Donations: Convalescent donors which are part of our study are individuals recovered from COVID-19 (confirmed by a positive PCR test). They were recruited to provide Source Plasma for manufacturing into an immune globulin product with high titers of SARS-CoV-2 antibody to be tested as a treatment for COVID-19 in a global NIH-NIAID clinical trial at CSL Plasma donation centers across USA. All donors signed a written informed consent before their first donation. The informed consent covers the legal approval of the specimens for research purpose and protects the anonymity of the subjects. For this study no intervention on the subjects was carried out negating the need for a human subjects committee approval.
Longitudinal Donor Cohort:26 donors of North American demography (age 23-62, female 44.4%, male 55.6%) were identified and monitored in the timeframe between April and September 2020 prior to emergency use authorization of SARS-CoV-2 vaccines. These donors provided between 4 and 10 donations; 32-168 days post a positive PCR test (PPP). No further selection criteria were applied. Post-collection, plasma samples were anonymized at CSL Plasma centers and sent to testing laboratories in CSL Behring and Siemens Healthineers for the longitudinal evaluation of a panel of serological, inflammation, and coagulation biomarkers. An anonymized self-assessment questionnaire was used to collect long-term symptomatic data. The study design and overview on donors in the study is summarized in (Figure 1 & Table S1).
Sample handling: Convalescent plasma (4% sodium citrate plasma) was collected by the CSL Plasma donation centres in the US using a standard plasmapheresis system and stored at -25°C. Samples were thawed at room temperature (RT) (~1h) and screened for NC protein-binding IgG using the ARCH SARS-CoV-2 IgG assay (Abbott) according to manufacturer instructions. Donations above the positive cut-off (1.4) were classified as convalescent donations. The samples were subjected to a minimum of 3 freeze-thaw cycles before being analysed in the individual serology and biomarker assays (storage condition: -80°C, thawing procedure: 37°C water bath for 5-10 min). Three pre-pandemic citrated plasma pools consisting of 10,086, 13,341, and 4,503 donations were used as negative controls.
Statistical Analysis
For statistical analysis JMP v16.0.0 was used. Data was transformed with a logarithmic function to normal distribution in case of t-test for quantitative data (significance limit p< 0.05), for qualitative data, a Chi-squared test was performed (significance limit p< 0.05). All linear correlation analysis was done with the REML method and crosschecked using the non-parametric Spearman’s correlation method. In case of multi-variate correlation analysis, REML method was used. For specific cases, pairwise correlation was used and has been mentioned accordingly. For the cluster analysis with numerical continuous variables, first a principal component analysis was done to reduce the dimensionality. Subsequently, a k-means clustering was performed on the two principal components representing the maximum variance in the data. For the latent class analysis on the categorical variables, only two clusters were formed to best represent the binary classification of outcome for all biomarkers. Additionally, to simplify latent class analysis ‚mild’, ‚moderate ‘, and ‚asymptomatic‘ were collated under ‚non-severe‘category.
Virus Neutralization Test (VNT)
NAb titres in plasma were assessed according to the method previously described by Schwaiger et al [19].
Automated Serology Chemiluminescence Immunoassays (CLIA) For Binding Analysis Against S1- Receptor Binding Domain (RBD) Antigen
Samples were tested for S1-RBD specific IgG and total antibodies using Atellica® IM SARS-CoV-2 IgG (COV2G), Dimension Vista® SARS-CoV-2 IgG (COV2G), Atellica IM SARS-CoV-2 Total (COV2T) and Dimension Vista SARS-CoV-2 Total (COV2T) assays (Siemens Healthineers).
In-house surrogate Virus Neutralization Test (sVNT)
(For investigational use only (IUO)) Samples were tested for S1-RBD specific antibodies with an in-house sVNT CLIA (COV2N) on Dimension Vista Analyzer (Siemens Healthineers) based on antibody-mediated inhibition of ACE2-S1-RBD interaction.
In-house ELISA for antibodies against different viral antigens (IUO) The in-house ELISAs were performed as described in Kober, et al. [20].
Laboratory Biomarkers
Plasma D-dimer and F1+2 levels were measured using INNOVANCE® LOCI® hs D-Dimer and INNOVANCE D-Dimer Reagent and INNOVANCE LOCI F 1+2 Reagent, on the Atellica COAG 360 System. Alpha2-antiplasmin (α2), plasminogen and VWF activity (Ac) were determined using Berichrom® α-2 antiplasmin, Berichrom Plasminogen and INNOVANCE VWF Ac assays, respectively, on the BCS XP® System. Plasma CRP, SAA, and Fibrinogen levels were measured using CardioPhase® hsCRP assay on the BN ProSpec® System. All reagents and instruments from Siemens Healthineers. The reference intervals of the assays are summarized in (Table 1). Anti-PF4-heparin antibodies were assessed using ASSERACHROM HPIA anti-PF4/heparin ELISA (Diagnostica Stago Inc.).
Results and Discussion
Longitudinal SARS-Cov-2 Serological Study
In this longitudinal study, NAb titres were measured with a gold-standard wild-type SARS-CoV-2 VNT in Vero cells (n=19) (Figure 2A) and additionally with COV2N a sVNT (n=25) (Figure 2B). Initially, all donors had detectable NAb titres (VNT, range 104.4 - 2,227.2 IU/ml). The NAb titre goes down from a median level of 510.5 IU/ml in the first 75 days of sampling to 188.6 IU/ ml for the remainder of the study (Figure 2A+C, Table 1). The sVNT showed strong positive correlation to VNT with REML correlation r = 0.92 and p < 0.0001 (Spearman’s ρ = 0.92 and p < 0.0001 for nontransformed data) (Figure 3A).
Next, we used in-house anti-NC, anti-S1 IgG, and IgM ELISAs as well as four high-throughput anti-S1-RBD chemiluminescence immunoassays (CLIA) to track levels of SARS-CoV-2 specific IgG, IgA, and IgM antibodies over the study duration (Figure 3B+C, 4A-F). We found positive correlation between VNT and all four anti-SARSCoV- 2 CLIA as well as the anti-S1 IgG ELISA (REML correlation, r = 0.74 to 0.87, p <0.0001) Figure 3A. The anti-S1 IgM ELISA and anti- NC IgG and IgM ELISAs showed weaker correlation to neutralization titre (REML correlation r = 0.39 for both IgM ELISAs and r = 0.48 for the IgG ELISA, p = 0.01) (Figure S1).
All donors tested reactive in the anti-IgG ELISAs with high initial titres that declined over time but remained above assay cut-off level at the end of the study. IgG titre levels were consistently higher than IgM titre levels. 70.6% of the donors seroconverted in the anti-S1 IgM ELISA and all had seroreverted within 134 days PPP. Only 29.4% were initially reactive in the anti-NC IgM ELISA with even earlier seroreversion. The female cohort displayed a higher initial anti-NC IgM level compared to the male cohort (Figure 4A+B).
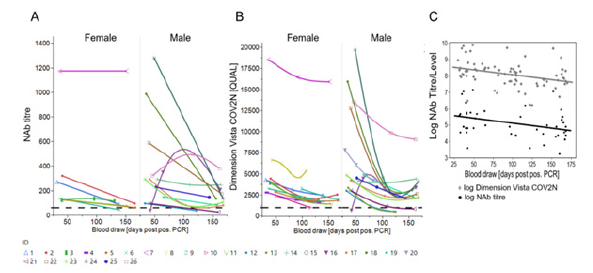
Figure 2: Longitudinal trend of the SARS-CoV-2 Nab titre in Donor Cohorts (A) NAb titre based on live VNT in Vero cells (cut-off 104.4 IU/ml). (B) sVNT (Dimension Vista COV2N assay) with a cut-off of 1,000 [QUAL] plotted against time [blood draw (days PPP)]. Female and male donors are separated. (C) NAb titre/level obtained by both assays were transformed into logarithmic scale for better comparison and statistical analysis and are plotted against time [blood draw (days PPP)). Shown is the line of fit of a linear function.
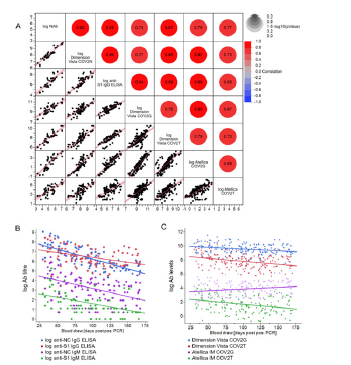
Figure 3: Comparison between SARS-CoV-2 Nab and anti-SARS-CoV-2 binding antibody titre from ELISA and high-throughput assays and their longitudinal trends (A) REML r values are shown as an indicator of correlation between log NAb titre and log- Dimension Vista CoV2N assay [QUAL], anti-S1 IgG ELISA [titre], Dimension Vista COV2G assay [QUAL], Dimension Vista COV2T assay [QUAL], Atellica IM COV2G assay [Index] and Atellica IM COV2T assay [Index]. (B) Ab titres obtained by anti-NC IgG and anti-IgM ELISA and anti-S1 IgG and IgM ELISAs were transformed into logarithmic scale for better comparison and statistical analysis and are plotted against blood draw (days PPP). Shown is the line of fit of a linear function. (C) Ab levels [QUAL and Index] obtained by the high-throughput immunoassays Dimension Vista COV2T and Dimension Vista COV2G as well as Atellica IM COV2G and Atellica IM COV2T were transformed into logarithmic scale for better comparison and statistical analysis and are plotted against blood draw (days PPP). Shown is the line of fit of a linear function.
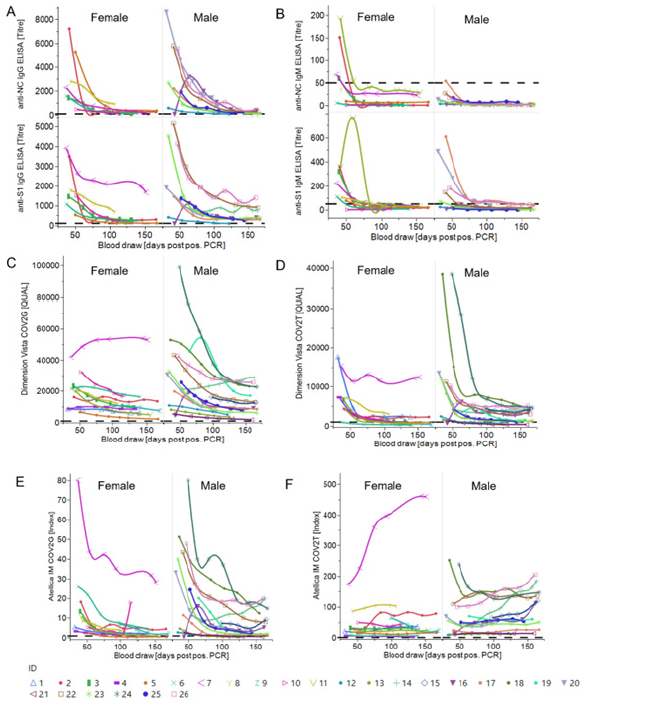
Figure 4: Longitudinal trends of anti-SARS-CoV-2 antibody levels from in-house ELISAs and high-throughput assays in male and female donors (A) Anti-S1 and anti-NC IgG ELISA titre plotted against the time [blood draw (days PPP)]. Titres of individual donors separated by gender are shown. Cut-off is set at a titre of 100. (B) Anti-S1 and anti-NC IgM ELISA titre plotted against the time [blood draw (days PPP)]. Titres of individual donors separated by gender are shown. Cut-off is set at a titre of 50. IgG Ab level (C+E) or total Ab level (IgG, A, M) (D+F) based on highthroughput immunoassays (Dimension Vista COV2G + T (C+D) and Atellica IM COV2G + T (E+F)) with a cut-off of 1,000 QUAL (Dimension Vista assay) and 1 Index (Atellica IM assay) and plotted against the time [blood draw (days PPP)]. Shown are individual donors separated by gender.
The assays Atellica IM COV2G and Dimension Vista COV2G, COV2T also showed a declining trend in the antibody levels except Atellica IM COV2T showing an increase (Figure 3C, 4C-F). Atellica IM COV2T and Dimension Vista COV2G assay levels of all donors stayed reactive throughout the total of 168 days (Figure 4 C+F). Results of the serology assessment is collated in Table 1. Finally, in-house ELISAs were used for longitudinal characterization of anti-SARS-CoV-2 IgG subtypes and IgA antibodies in 12 randomly chosen donors for a time frame of 30-100 days post a positive PCR assay. Titre levels of IgG subtypes followed the trend IgG3>IgG1>IgG2>IgG4 over entire study and showed a general decrease against all tested SARS-CoV-2 antigens. 75% of the donors were anti-Spike S1 IgA reactive at the initial timepoint and showed decreasing titres over time (Figure S2). Table S2 and S3 show the performance characteristics of the in-house ELISAs assessed prior to the longitudinal characterization of the donors.
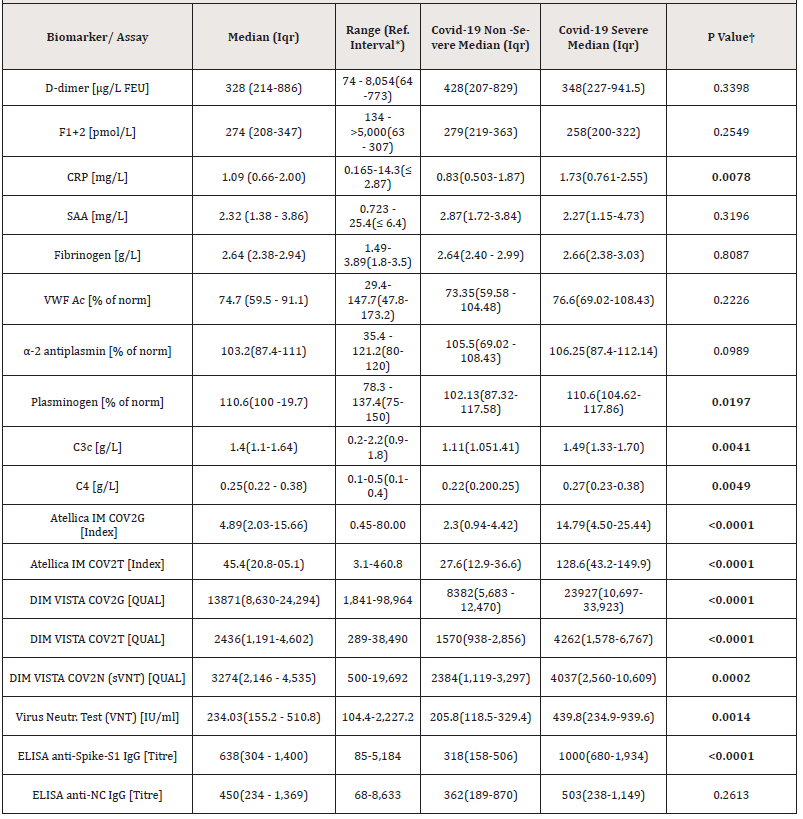
Table 1: Overview on tested biomarkers and SARS-CoV-2 serological assays and comparison to disease severity.
Statistical analysis between groups (non-severe and severe COVID-19) was performed by t-test.
†Data was transformed with a logarithmic function to normal distribution (significance limit p< 0.05)
*Reference interval, 2.5th to 97.5th percentile
**Difference between severe (n = 10) and non-severe (n = 7) COVID-19 (non-severe = asymptomatic, mild, moderate) donors.
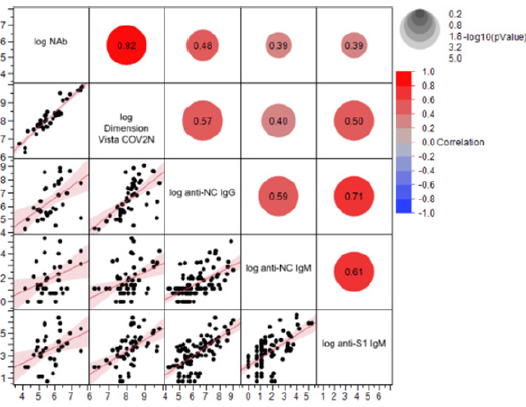
Supplemental Figure S1: Correlation between Nab titre, anti-SARS-CoV-2 ELISA titre, and high-throughput anti-SARS-CoV-2 assays. REML r values are shown as an indicator of correlation between NAb titre (VNT), Dimension Vista CoV2N assay [QUAL] (sVNT), anti-NC IgG, anti-S1 IgM and anti-NC IgM titres (ELISAs). All data were transformed to log scale.
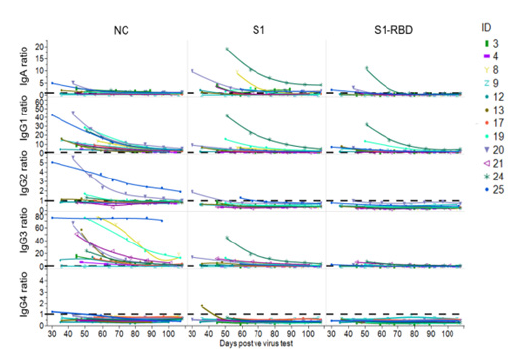
Supplemental Figure S2: Longitudinal trend of COVID-19-specific immunoglobulin subclasses and isotypes. Decrease of COVID-19 specific IgA, IgG1, IgG2, IgG3, IgG4 Abs in 12 randomly selected donors directed against NC-, Spike S1- and S1-RBD SARS-CoV-2 antigens over a period of ~110 days. Samples were diluted 1:50 for IgG2 and IgG4 and 1:300 for IgA, and IgG3 and 1:100 for IgG1. Ratios were calculated for better comparison. For this, OD values of the samples were divided by a negative control value. As “negative control” 3 pre-pandemic plasma pools and a negative plasma sample were used. The mean value of this negative control + 4 x SD was used to calculate the respective ratios. The dotted line indicates the baseline level.
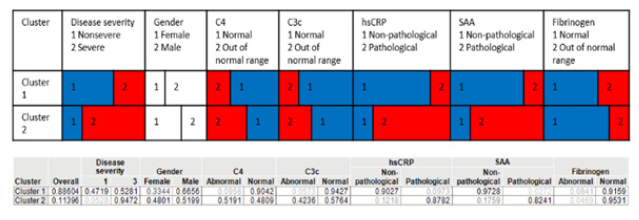
Supplemental Figure S3:Multiparametric latent class analysis for detection of association between biomarkers and donor characteristics. Latent class analysis including the parameters: disease severity, gender, C4, C3c, hsCRP, SAA, Fibrinogen. Cluster 2 represents a group with respective likelihood for all the biomarkers and predicts a higher disease severity. Cluster 1 predicts a likelihood of having a lower disease severity with corresponding likelihoods for the biomarkers. Non-severe category included mild, moderate, and asymptomatic cases.
Longitudinal Study of Laboratory Biomarker
F1+2, D-dimer, and further reactants of the fibrinolytic system and acute phase, including plasminogen, α-2 antiplasmin, Fibrinogen, CRP, SAA, biomarker of endothelial and complement activation, comprising VWF Ac, C3c, and C4 were longitudinally assessed. While some of the biomarkers studied here have got clinically validated cut-off values, these have been defined for a specific clinical decision apart from COVID-19. We decided, therefore, to use the upper reference limit (URL) as orientation for biomarker levels, accepting the downside that, by virtue of design, 2.5% of the general population shows biomarker levels above this limit. Results of the laboratory biomarkers assessment is collated in (Table 1, Figure S4).
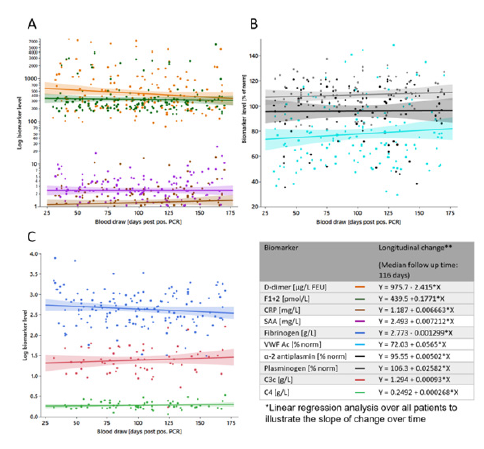
Supplemental Figure S4:Overview on tested biomarkers longitudinal change. Biomarker levels from all donors are plotted against blood draw (days PPP). Shown is the line of fit of a linear function for (A) D-dimer (orange), F1+2 (green), CRP (brown), SAA (purple), (B) VWF Ac (light blue), α-2 antiplasmin (black), plasminogen (grey) (C) Fibrinogen (blue), C3 (red), and C4 (light green).
F1+2 and D-Dimer Levels are Markedly Elevated During Convalescence
Endogenous thrombin formation was quantified using the immunochemical detection of F1+2. Median (Inter-Quartile Range, (IQR)) F1+2 levels of the donors were 274 pmol/L (208-347), with significant intra- and inter-individual variation (range 134 to > 5,000 pmol/L). F1+2 levels above the URL of 307 pmol/L, were observed in 15 (57.69%) of the donors. Moreover, persistent F1+2 with median peak level of 2,442 pmol/L were observed in seven (26.92%) of the individuals, with high intra-individual variation, for a median of 163 days PPP. Eleven donors presented with F1+2 levels in the reference range (Figure 5A, Table 1).
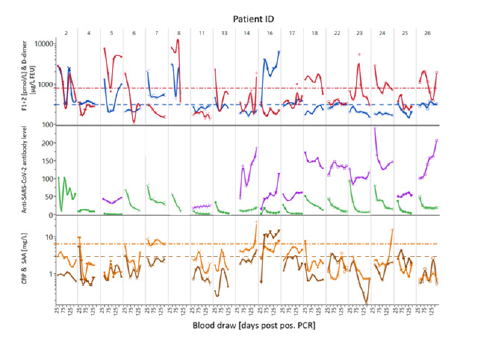
Supplemental Figure S5:Comparison of longitudinal trends of biomarkers and anti-SARS-CoV-2 antibodies in selected donors. Trajectories of CRP (—), SAA (—) and anti-SARS-CoV-2 S1-RBD IgG and total antibodies measured with Atellica IM COV2G (—) or COV2T (—), in selected donors with D-dimer (—) and F1+2 (—) levels above reference range. The dashed lines represent the upper reference limit.
Median (IQR) D-dimer was 328 μg/L FEU (Fibrin Equivalence Unit) (214-886), with significant intra- and inter-individual variation (range 74 - 8054 μg/L FEU) (Figure 5B, Table 1). While 14 (53.8%) subjects had D-dimer levels above the URL (> 773 μg/L FEU), seven (26.92%) of the donors had sustained elevated D-dimer with peak levels of more than 1,775 μg/L FEU. While 12 (46.15%) donors showed normal D-dimer levels throughout the study, the D-dimer levels of four (15.38%) donors normalized within 70 days PPP.
CRP, SAA, Fibrinogen, VWF-Activity, and Complement Factors Were in Normal Range for The Majority of Donors
The levels of CRP, SAA, and Fibrinogen were found within reference range in most of the donors. Median (IQR) Fibrinogen, SAA, and CRP in the donor cohort were 2.64 g/L (2.38-2.94), 2.32 mg/L (1.38-3.86) and 1.09 mg/L (0.66-2.00), respectively (Figure 5C-E, Table 1). None of the donors had an elevated Fibrinogen level >3.5 g/L (reference range, 1.8 - 3.5 g/L). CRP and SAA levels were only mildly elevated in 8 donors (30%) each, with a maximum of 14.3 and 25.4 mg/mL, respectively. Only one donor had a CRP elevation above the upper normal threshold for the North American population (10 mg/L), which also correlated to the longitudinally elevated F1+2 response (Figure 5C, 6C).
VWF Ac was found within reference interval in 92% of the donors. Median (IQR) VWF Ac was, 74.7 (59.5-91.1) % of norm, ranging from, 29.4 - 147.7 % of norm (reference interval, 47.8-173.2 % of norm) (Figure 5F, Table 1). 89% of the donor samples tested for complement factors were within reference interval (median (IQR) C3c, 1.4 (1.16 - 1.64), C4, 0.25 (0.22 - 0.38)) (Table 1).
Plasminogen and α-2 Antiplasmin
We determined the α-2 antiplasmin and plasminogen activity to screen for fibrinolytic disorders. Median IQR α-2 antiplasmin and plasminogen activity was 103.2 (87.4 - 111) % of norm and 110.6 (100 - 119.7) % of norm, respectively. Interestingly, five donors with elevated F1+2 or D-dimer levels were measured with α-2 antiplasmin below the lower reference limit (LRL), indicating hyper-fibrinolytic activities. All donor samples tested for plasminogen activity were found within normal range (75-150% of norm). Detailed results are compiled in Table 1.
Convalescent Donor Samples Non-Reactive for Anti-PF4/ Heparin Antibodies
None of the 21 donors assessed (ranging 41-168 days PPP) were reactive for HIT antibodies in the ASSERACHROM HPIA anti- PF4/heparin ELISA.
Antibody and Selected Biomarker Levels in Association with Disease Severity
An anonymized self-assessment questionnaire was used to collect data on disease severity and long-term symptoms. Ten donors in the study had a severe, four a moderate, two a mild, and one an asymptomatic case of COVID-19. For nine donors no data on the clinical status is available. The classification of the disease severity was based on the subjective perception of the donors. Majority of the donors were outpatient, two individuals with severe cases needed hospitalization with one requiring ventilation. Five donors with severe disease, and one with moderate disease classification (donor 9, 11, 12, 14, 17, 18) reported symptoms of partial recovery, symptomatic for long COVID-19 state (fatigue, shortness of breath, high liver enzyme). All data from the donor survey is collated in Table S1.
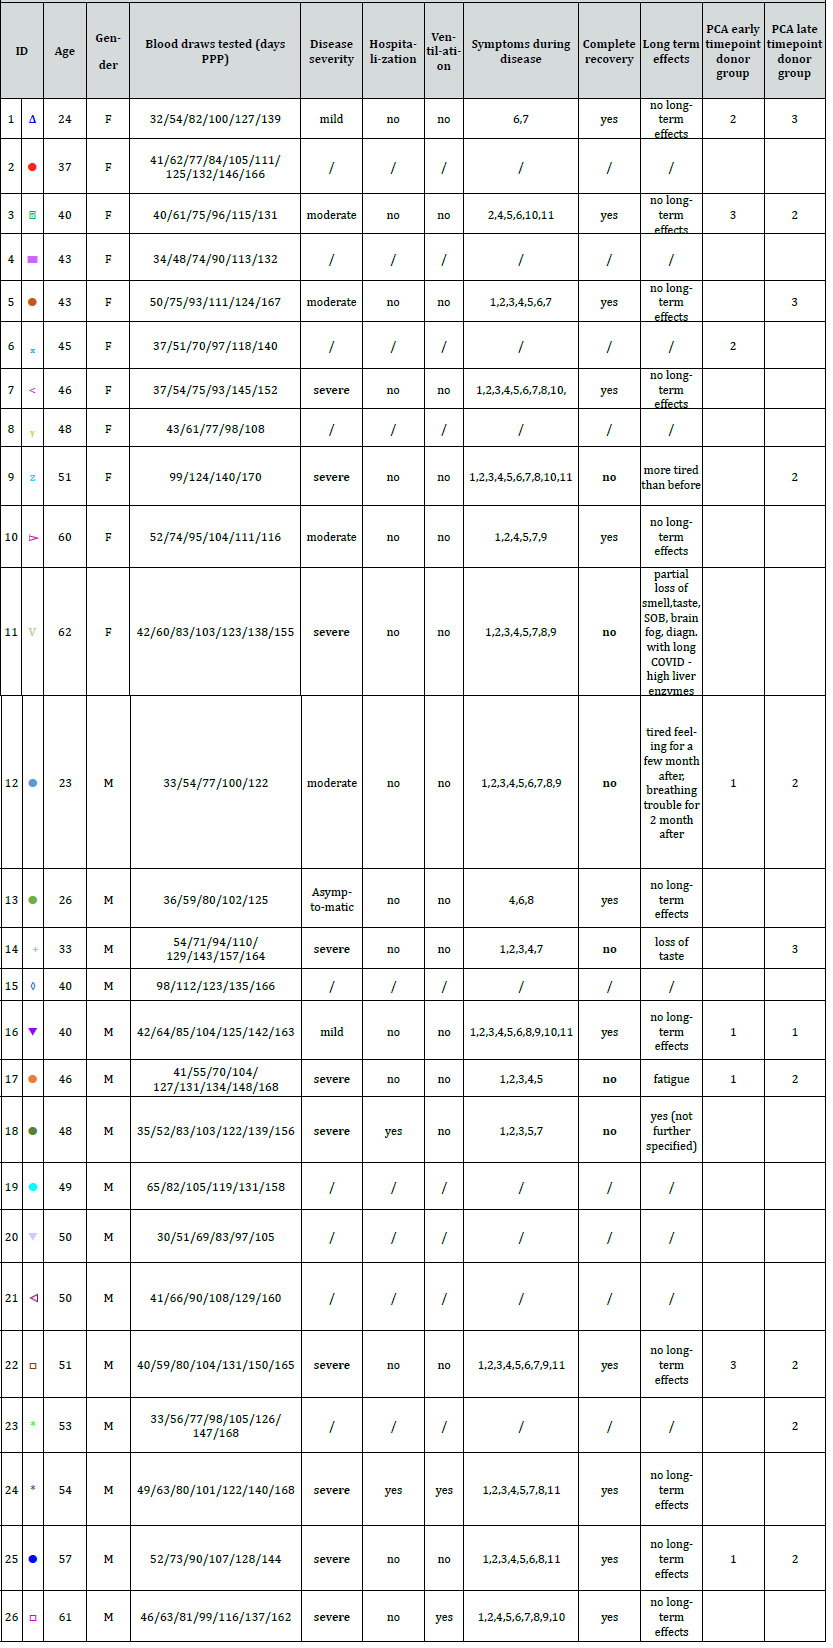
Table S1.: Summary of donor characteristics including gender, age, time point of donations and results of the self-assessment questionnaire used for grouping donors into clusters.
Symptoms during disease: 1. Fever or chills / 2. Cough / 3. Shortness of breath or difficulty breathing / 4. Fatigue / 5. Muscle or body aches / 6. Headache / 7. Loss of taste or smell / 8. Sore throat / 9. Congestion or runny nose / 10. Nausea or vomiting / 11. Diarrhea / 12. No symptoms
Data from donor characteristics was used to build correlation with serological and coagulation activation, fibrinolytic and acute phase biomarkers in the studied cohort. In univariate analysis we found that virus‐specific Ab levels were significantly higher in participants with severe disease than in those with moderate, mild, or asymptomatic COVID-19. Mainly anti-S1 and anti-RBD, but not anti-NC antibody levels, were positively correlated to disease severity (p<0.0001-p=0.0014). Moreover, a relationship to disease severity was observed for CRP, C3, C4, and plasminogen level, p=0.0078, p=0.0041, p=0.0049 and p=0.0197, respectively. Median (IQR) biomarker and serological immunoassay levels for the severe and non-severe donor groups are summarized in Table 1.
Disease severity was associated with an increased risk of longterm symptoms (LTS). Five of the six donors with LTS had a severe COVID-19, one a moderate case (Table S1). Interestingly, in relation to disease severity, donors with long-term pathogenesis were found to have significantly lower anti-S1, anti-S1-RBD and anti-NC antibody, D-dimer, and Fibrinogen levels, but higher SAA levels, compared to the individuals that fully recovered (Table 2).
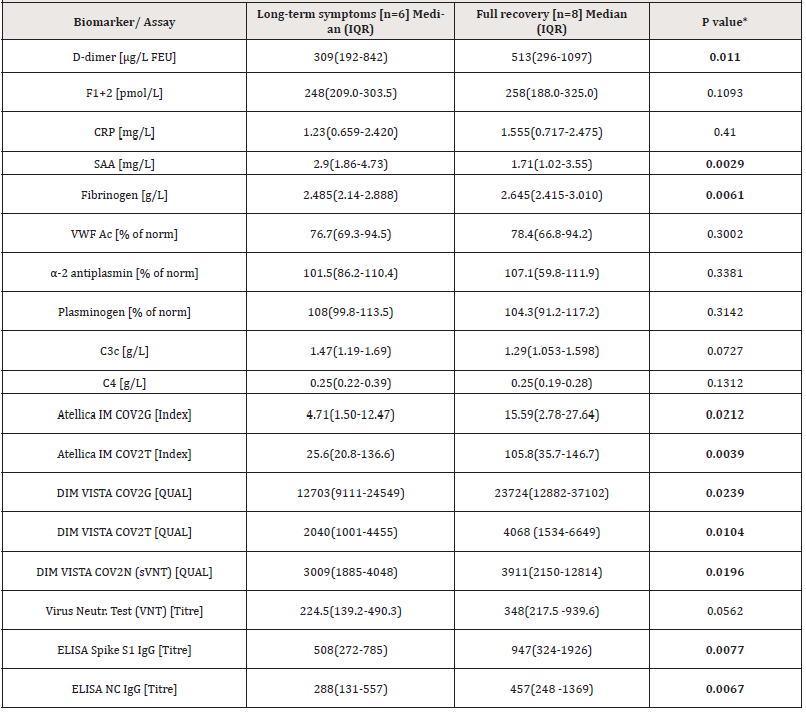
Table 2.: Comparison of anti-SARS-CoV-2 antibody and biomarker level between donors reporting long-term symptoms and donors with full recovery.
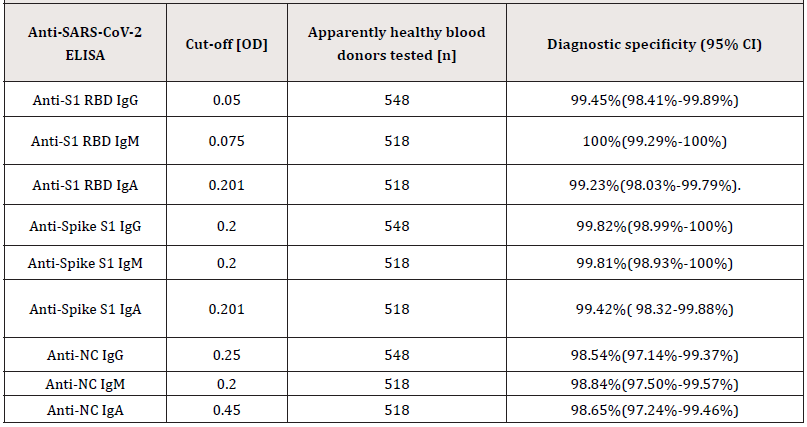
Supplemental Table S2.:Diagnostic specificity of the in-house anti-SARS-CoV-2 ELISA was determined by testing 518 to 548 citrated plasma samples collected prospectively prior to the COVID-19 outbreak (before December 2019) from apparently healthy individuals.
Abbreviations: Confidence Interval (CI).
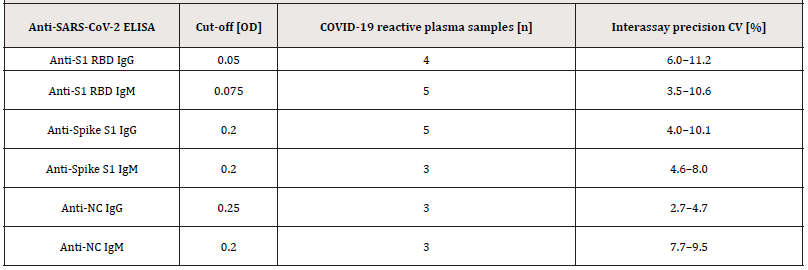
Supplemental Table S3.:Inter-assay precision was conducted by testing 3-5 COVID-19 reactive citrated plasma samples in 4-fold determination in 11 independent runs.
Abbreviations: Coefficient of Variation (CV).
In a next step, principal component analysis on correlation of different biomarkers (F1+2, D-Dimer, CRP, SAA, VWF Ac, and α-2 antiplasmin) was performed. As a prerequisite, Bartlet’s test was performed to determine whether significant correlation exists among the tested parameters. Only parameters with p-values <0.05 were taken for k-means clustering to put donors into three groups. The analysis was carried out for early timepoint (median 41 days) and late timepoint (median 153.5 days) to identify groupcharacteristics changes over time (Figure 6 A+B & Table S1). The group with majority of donors (Cluster 1) at early timepoint had highest mean level of F1+2, VWF Ac, and α-2 antiplasmin. Donors with highest mean D-dimer levels also had highest CRP and SAA levels (Cluster 2). For the late timepoint, the majority cluster represented donors with lowest mean biomarker levels as expected in recovered cohort (Cluster 3). Donor 16 had highest level of F1+2, CRP, and VWF Ac albeit reporting a mild disease and complete recovery. The latent class analysis shows association of disease severity with levels out of normal range of C3 (0.9≤ C3g/L ≤1.8), C4 (0.1≤ C4g/L ≤0.4), CRP (>2.87 mg/L), and SAA (>6.4 mg/L) (Figure S3).
Multivariate analysis covering all tested biomarkers revealed a broad correlation range among the tested biomarkers (Figure 6C). F1+2 levels only correlated with CRP levels (REML correlation, r= 0.40, p=0.0070). CRP levels further correlated with further acute phase markers SAA, Fibrinogen, and NAb (REML correlation, r= 0.51, 0.50, and 0.45 respectively, p<0.0001-0.0070). Antiplasmin levels correlated with NAb levels (REML correlation, -0.48, p=0.0439).
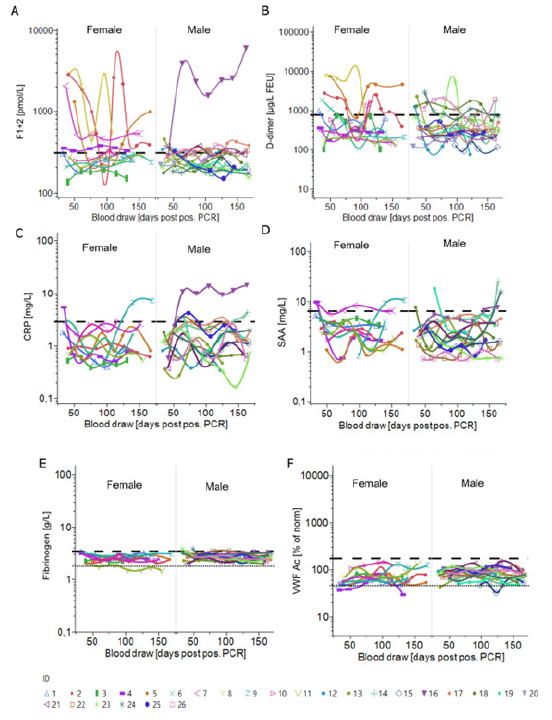
Figure 5:Multiparametric donor cohort characterization with principal component analysis followed by K-means clustering (A) Principal component analysis of early timepoints (median 41 days PPP) and late timepoints (median 153.5 days PPP) (B) Principal components PC1 and PC2 are constructed combining the following parameters: F1+2, D-dimer, CRP, SAA, VWF Ac, α-2 antiplasmin. Donors could be clustered into 3 separate groups based on K-means clustering based on the values of the PC1 and PC2. Equations for PC1 and PC2 are mentioned in the method section. PC1 and PC2 represents 99.2% variance in data for early timepoint. PC1 and PC2 represents 98.6% variance in data for late timepoint. (C) REML correlation is shown for log-NAb, IgG and total Ab level measured with the Dimension Vista COV2G and T assays and a set of biomarkers including F1+2, D-dimer, CRP, SAA, fibrinogen, VWF, α-2 antiplasmin and plasminogen.
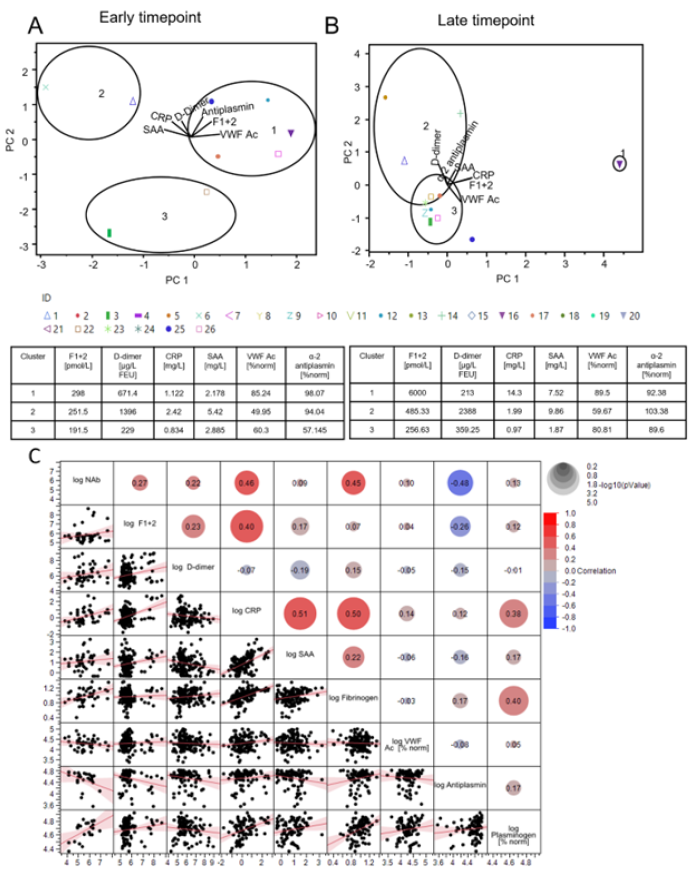
Figure 6:Longitudinal trends of coagulation, acute phase and endothelial biomarkers for female and male donors
(A) F1+2 (pmol/L).
(B) D-dimer (μg/L FEU) determined by INNOVANCE LOCI assays.
(C) CRP (mg/L).
(D) SAA (mg/L).
(E) Fibrinogen (g/L).
(F) VWF Ac (% of norm) plotted against the time [blood draw (days PPP)].
Shown are individual donors separated by gender. The dashed/dotted lines represent the upper reference limit/lower reference limit.
Conclusion
This study is focused on the longitudinal characterization of the anti-SARS-CoV-2 antibody response and trajectories of thrombin activation, fibrinolysis, inflammation, and endothelial function biomarkers, in 26 donors from USA. We investigated the interaction and the potential of these biomarkers of disease severity and prognosis, to predict clinical courses and long-term outcomes in COVID-19 convalescence. Similar to other studies, we find a decrease in the VNT level over time with the median NAb titre decreasing 2.7-fold within 4 months [6,7]. Comparable results were achieved with the sVNT showing a correlation of r = 0.92 to the cell based VNT (Figure 3A).
All studied antibodies irrespective of the type and antigen showed a gradual overall decrease. Anti-S1 IgG levels correlated better to VNT than NC IgG titers as also seen in other studies [21-23] most likely due to antibody maturation and repeated presentation of S1 as antigen. We also observed better correlation of IgG than IgM to VNT level, most likely due to antibody maturation. Interestingly, following on from our earlier study [20], subtyping ELISAs showed IgG3 and IgG1 as the prominent contributors of humoral response against SARS-CoV-2 and the levels followed the same trend as total IgG (Figure S2). The CLIA (Atellica IM COV2T, COV2G, and Dimension Vista COV2T, COV2G) also demonstrated correlation to VNT with a REML r ranging from 0.74-0.87.
This demonstrates that the high throughput assays can be used for qualitative and semi-quantitative epidemiological studies of COVID-19. All the assays barring Atellica IM COV2T assay showed a gradual decrease as seen also in the in-house ELISAs. The slight increase in total antibody levels in the Atellica IM COV2T assay may reflect a compensation of decreasing antibody levels by increasing antibody affinity or avidity over time, in combination with the antigen bridging assay principle (Figure 3C).
We observed that donors with a reported severe course of COVID-19 displayed higher antibody levels to S1 and RBD as the target antigen (Table 1) similar to other studies [21-23]. CRP, C3, C4, and plasminogen also correlated significantly to disease severity. In contrast to the increased antibody response in severe COVID-19 cases our data further suggest an association between lower anti-S1, anti-S1-RBD and anti-NC antibody levels and the risk for long-term pathology. The lower anti-SARS-COV-2 antibody levels in donors developing sustained symptoms might support a dysregulated Fcү receptor dependent viral control, which is further supported by the observation that long-term symptoms improved after vaccination [24,25]. Increased plasma levels of D-dimer have been shown to be an independent biomarker for severity and poor prognosis in acute infection [26-28] and are associated to thrombotic events with high sensitivity, but limited specificity [13,28,29].
Similar to other studies, we observed markedly elevated and sustained D-dimer or F1+2 in 26.9% of the donors with peak levels up to 8,054 μg/L FEU and >5,000 pmol/L, respectively, accompanied with only mildly increased or normal acute phase biomarkers [16,30]. We found no evidence of hyper- or hypofibrinogenemia and, the occurrence of VWF AC levels mainly in the normal range suggest that COVID-19 convalescent donors do not present with endothelial cell activation in their recovery phase. This is in contrast to other studies [31], and further adequately powered clinical trials addressing additional biomarkers of endothelial dysfunction and glycocalyx disruption, will be required to exclude the persistence of endothelial cell activation in convalescence [32,33,34-36].
To identify potential foretellers of elevated D-dimer and F1+2, we performed a multivariate correlation analysis of all tested biomarkers (Figure 6C). F1+2 was significantly associated with CRP, the overall low levels of the acute phase reactants, including SAA, Fibrinogen, plasminogen, and complement factors however indicate, that inflammation alone is not the main driver of abnormal coagulation function in COVID-19 convalescence. Notably, we observed that trajectories of elevated D-dimer and F1+2 followed the same trend as the antibody response for the majority of donors (Figure S5). Although clinical evidence of any thrombotic event was absent in the studied cohort, the presence of thrombotic manifestations for all participants of the study can’t be ruled out. In several studies, hospitalized (non-ICU) COVID-19 patients with high D-dimer levels were diagnosed with asymptomatic thrombotic events [32-34].
An association of D-dimer levels > 1570 μg/L FEU and asymptomatic DVT was shown (OR 9.1; 95% CI 1.1-70.1) [33]. 42% of the donors monitored in our study had D-dimer peak levels exceeding 1570 μg/L FEU. Of note, 75% of the donors with symptoms of dyspnoea had elevated D-dimer or F1+2 suggesting an association to COVID-19 related lung injury [35]. Single parameter t-test analysis and multiparametric Latent class analysis showed clear association between disease severity and levels of CRP, C3c, C4, and high IgG titres. Donors with long-term symptoms had significant lower anti-S1, anti-S1-RBD, and anti-NC antibody, D-dimer, and Fibrinogen levels and higher SAA levels, compared to recovered donor cohort. Serial plasmapheresis procedure could be a potential limitation of the study. However, all samples were treated similarly and can be compared. Furthermore, other studies have demonstrated that D-dimer and F1+2 levels or acute phase markers are not disturbed by apheresis [36-38]. Lack of clearly defined clinical phenotypes is another limitation of the study. Statistical power of this study is limited due to the small cohort size however all outcomes are significant and similar to other studies with larger donor cohorts [39-42]. In conclusion, this study found a robust development of NAb in SARS-CoV-2 convalescents with decreasing levels over time. While antibody levels to S1 and S1-RBD associated with disease severity, anti-S1, anti-S1-RBD and anti-NC antibody concentration was impaired in donors with long-term pathology. Further investigation into the clinical utility of elevated D-dimer and F1+2 in identifying donors with a risk for thrombotic complications in post COVID-19 is warranted. This study underlines the necessity for larger observational studies to monitor progression of serological and laboratory biomarkers Marksres in a growingly vaccinated population challenged with emerging SARS-CoV-2 variants like Omicron.
Acknowledgments
The authors would like to acknowledge Sara Stinca, Carolin Balouschek, Christa Duwe, Lena Gebauer, Lars Heerdegen, Anna- Lena Grill, Timo Hanikl for logistical support and laboratory analysis.
Author Contributions
S Mukherjee, H Schwarz and C Kober conceived and designed the study. The laboratory work was undertaken by H Schwarz, S Mukherjee, C Kober, T Vogel, M Gerlach. The data were analyzed by S Mukherjee, H Schwarz, and C Kober. S Mukherjee, H Schwarz, C Kober, A Hahn, wrote the manuscript. The study was reviewed by TL Simon, N Zander, Q Wei, T Barnes. R Jenness and C Chastain supervised donor screening, sample logistic and supported the selfassessment questionnaire. The project was supervised by U Kalina, B Keiner, P Schuetz, M Vey, E. Widmer, and NJ Roth.
Conflict of Interest
All authors are employees of either CSL Behring AG, CSL Behring Innovation GmbH, CSL Plasma, or Siemens Healthcare Diagnostics. The information in this paper is based on research results that are not commercially available.
References
- Na Zhu, Dingyu Zhang, Wenling Wang, Xingwang Li, Bo Yang, et al. (2020) A Novel Coronavirus from Patients with Pneumonia in China, 2019. N Engl J Med 382(8): 727-733.
- Guan W J, Ni Z Y, Hu Y, Liang W H, Ou C Q, et al. (2020) Clinical Characteristics of Coronavirus Disease 2019 in China. New Engl J Med 382: 1708-1720.
- Rajesh T Gandhi, John B Lynch, Carlos Del Rio (2020) Mild or Moderate Covid-19. New Engl J Med 383(18): 1757-1766.
- Zsuzsanna Varga, Andreas J Flammer, Peter Steiger, Martina Haberecker, Rea Andermatt, et al. (2020) Endothelial cell infection and endotheliitis in COVID-19. Lancet 395(10234): 1417-1418.
- Claire S Whyte, Gael B Morrow, Joanne L Mitchell, Pratima Chowdary, Nicola J Mutch, et al. (2020) Fibrinolytic abnormalities in acute respiratory distress syndrome (ARDS) and versatility of thrombolytic drugs to treat COVID‐19. J Thromb Haemost 18(7): 1548-1555.
- Seow J, Graham C, Merrick B, Acors S, Steel KJA, et al. (2020) Longitudinal evaluation and decline of antibody responses in SARS-CoV-2 infection.
- Ania Wajnberg, Fatima Amanat, Adolfo Firpo, Deena R Altman, Mark J Bailey, et al. (2020) Robust neutralizing antibodies to SARS-CoV-2 infection persist for months. Science 370: 1227-1230.
- Florian Krammer (2021) Correlates of protection from SARS-CoV-2 infection. Lancet 397(10283): 1421-1423.
- William J Jenner, Rahim Kanji, Saeed Mirsadraee, Ying X Gue, Susanna Price, et al. (2021) Thrombotic complications in 2928 patients with COVID-19 treated in intensive care: a systematic review. J Thromb Thrombolys 51(3): 595-607.
- Maximilian Ackermann, Stijn E Verleden, Mark Kuehnel, Axel Haverich, Tobias Welte, et al. (2020) Pulmonary Vascular Endothelialitis, Thrombosis, and Angiogenesis in Covid-19. New Engl J Med 383(2): 120-128.
- Jean François Llitjos, Maxime Leclerc, Camille Chochois, Jean Michel Monsallier, Michel Ramakers, et al. (2020) High incidence of venous thromboembolic events in anticoagulated severe COVID‐19 patients. J Thromb Haemost 18(7): 1743-1746.
- Ling Zhi Hong, Zhang Xuan Shou, De Ming Zheng, Xue Jin (2021) The most important biomarker associated with coagulation and inflammation among COVID-19 patients. Mol Cell Biochem 476(7): 2877-2885.
- Seda Bilaloglu, Yin Aphinyanaphongs, Simon Jones, Eduardo Iturrate, Judith Hochman, et al. (2020) Thrombosis in Hospitalized Patients With COVID-19 in a New York City Health System. Jama 324(8): 799-801.
- Maxwell D Weidmann, Kenneth Ofori, Alex J Rai (2020) Laboratory Biomarkers in the Management of Patients With COVID-19. Am J Clin Pathol 155(3): 333-342.
- Antonin Trimaille, Jecko Thachil, Benjamin Marchandot, Anaïs Curtiaud, Ian Leonard Lorant, et al. (2020) D-Dimers Level as a Possible Marker of Extravascular Fibrinolysis in COVID-19 Patients. J Clin Medicine. 10(1): 39.
- Hanny Al Samkari, Fei Song, Elizabeth M Van Cott, David J Kuter, Rachel Rosovsky, et al. (2020) Evaluation of the prothrombin fragment 1.2 in patients with coronavirus disease 2019 (COVID‐19). Am J Hematol 95(12): 1479-1485.
- Swapna Mandal, Joseph Barnett, Simon E Brill, Jeremy S Brown, Emma K Denneny, et al. (2021) ‘Long-COVID’: a cross-sectional study of persisting symptoms, biomarker and imaging abnormalities following hospitalisation for COVID-19. Thorax 76(4): 396-398.
- Ani Nalbandian, Kartik Sehgal, Aakriti Gupta, Mahesh V Madhavan, Claire McGroder, et al. (2021) Post-acute COVID-19 syndrome. Nat Med 27(4): 601-615.
- Julia Schwaiger, Michael Karbiener, Claudia Aberham, Maria R Farcet, Thomas R Kreil, et al. (2020) No SARS-CoV-2 neutralization by intravenous immunoglobulins produced from plasma collected before the 2020 pandemic. J Infect Dis 222(12): 1960-1964.
- Christina Kober, Sandro Manni, Svenja Wolff, Thomas Barnes, Shatanik Mukherjee, et al. (2022) IgG3 and IgM Identified as Key to SARS-CoV-2 Neutralization in Convalescent Plasma Pools. Plos One 17(1): e0262162.
- Katharina Röltgen, Abigail E Powell, Oliver F Wirz, Bryan A Stevens, Catherine A Hogan, et al. (2020) Defining the features and duration of antibody responses to SARS-CoV-2 infection associated with disease severity and outcome. Sci Immunol 5(54): eabe0240.
- Joe M El Khoury, Wade L Schulz, Thomas J S Durant (2021) Longitudinal Assessment of SARS-CoV-2 Anti-Nucleocapsid and anti-Spike-1-RBD Antibody Testing Following PCR-Detected SARS-CoV-2 Infection. J Appl Lab Med 6(4):1005-1011.
- Yannick Galipeau, Matthew Greig, George Liu, Matt Driedger, Marc André Langlois, et al. (2020) Humoral Responses and Serological Assays in SARS-CoV-2 Infections. Front Immunol 11: 610688.
- Arnold D, Milne A, Samms E, Stadon L, Maskell N, et al. (2021) Are vaccines safe in patients with Long COVID? A prospective observational study. Medrxiv 2021.03.11.21253225.
- Ayoubkhani D, Bermingham C, Pouwels KB, Glickman M, Nafilyan V, et al. (2021) Changes in the trajectory of Long Covid symptoms following COVID-19 vaccination: community-based cohort study. Medrxiv 2021.12.09.21267516.
- Ning Tang, Dengju Li, Xiong Wang, Ziyong Sun (2020) Abnormal coagulation parameters are associated with poor prognosis in patients with novel coronavirus pneumonia. J Thromb Haemost 18(4): 844-847.
- Litao Zhang, Xinsheng Yan, Qingkun Fan, Haiyan Liu, Xintian Liu, et al. (2020) D‐dimer levels on admission to predict in‐hospital mortality in patients with Covid‐19. J Thromb Haemost 18: 1324-1329.
- Haoting Zhan, Haizhen Chen, Chenxi Liu, Linlin Cheng, Songxin Yan, et al. (2021) Diagnostic Value of D-Dimer in COVID-19: A Meta-Analysis and Meta-Regression. Clin Appl Thromb Hemost 27: 107602962110109.
- Robert M Kwee, Hugo J A Adams, Thomas C Kwee (2021) Pulmonary embolism in patients with COVID-19 and value of D-dimer assessment: a meta-analysis. Eur Radiol 31(11): 8168-8186.
- Liam Townsend, Helen Fogarty, Adam Dyer, Ignacio Martin Loeches, Ciaran Bannan, et al. (2021) Prolonged elevation of D‐dimer levels in convalescent COVID‐19 patients is independent of the acute phase response. J Thromb Haemost 19(4): 1064-1070.
- Helen Fogarty, Liam Townsend, Hannah Morrin, Azaz Ahmad, Claire Comerford, et al. (2021) Persistent endotheliopathy in the pathogenesis of long COVID syndrome. J Thromb Haemost 19(10): 2546-2553.
- Boun Kim Tan, Sabine Mainbourg, Arnaud Friggeri, Laurent Bertoletti, Marion Douplat, et al. (2021) Arterial and venous thromboembolism in COVID-19: a study-level meta-analysis. Thorax 76(10): 970-979.
- P Demelo Rodríguez, E Cervilla Muñoz, L Ordieres Ortega, A Parra Virto, M Toledano Macías, et al. (2020) Incidence of asymptomatic deep vein thrombosis in patients with COVID-19 pneumonia and elevated D-dimer levels. Thromb Res 192: 23-26.
- Dominic Wichmann, Jan Peter Sperhake, Marc Lütgehetmann, Stefan Steurer, Carolin Edler, et al. (2020) Autopsy Findings and Venous Thromboembolism in Patients With COVID-19: A Prospective Cohort Study. Ann Intern Med 173: 268-277.
- Genta Ishikawa, Samuel O Acquah, Mary Salvatore, Maria L Padilla (2017) Elevated serum D-dimer level is associated with an increased risk of acute exacerbation in interstitial lung disease. Resp Med 128: 78-84.
- P Hellstern, J Bach, H Haubelt, W E Hitzler, S Mathis, A Vogt (2001) The impact of the intensity of serial automated plasmapheresis and the speed of deep‐freezing on the quality of plasma. Transfusion 41(12): 1601-1605.
- Christopher A Tormey, Marie E Peddinghaus, Michelle Erickson, Karen E King, Melissa M Cushing, et al. (2010) Improved plasma removal efficiency for therapeutic plasma exchange using a new apheresis platform. Transfusion 50(2): 471-477.
- Burnouf T, Kappelsberger C, Frank K, Burkhardt T (2003) Protein composition and activation markers in plasma collected by three apheresis procedures. Transfusion 43: 1223-1230.
- Wenjing Ye, Weiwei Lu, Yanping Tang, Guoxi Chen, Xiaopan Li, et al. (2020) Identification of COVID-19 Clinical Phenotypes by Principal Component Analysis-Based Cluster Analysis. Front Medicine 7: 570614.
- Zaishu Chen, Furong Zhang, Weihua Hu, Qijian Chen, Chang Li, et al. (2020) Laboratory markers associated with COVID‐19 progression in patients with or without comorbidity: A retrospective study. J Clin Lab Anal 35(1): e23644.
- Aishwarya Venkataraman, Nathella Pavan Kumar, Luke Elizabeth Hanna, Sulochana Putlibai, M Karthick, et al. (2021) Plasma biomarker profiling of PIMS-TS, COVID-19 and SARS-CoV2 seropositive children - a cross-sectional observational study from southern India. Ebiomedicine 66: 103317.
- Lars Christian Lund, Jesper Hallas, Henrik Nielsen, Anders Koch, Stine Hasling Mogensen, et al. (2021) Post-acute effects of SARS-CoV-2 infection in individuals not requiring hospital admission: a Danish population-based cohort study. Lancet Infect Dis 21(10): 1373-1382.



 We use cookies to ensure you get the best experience on our website.